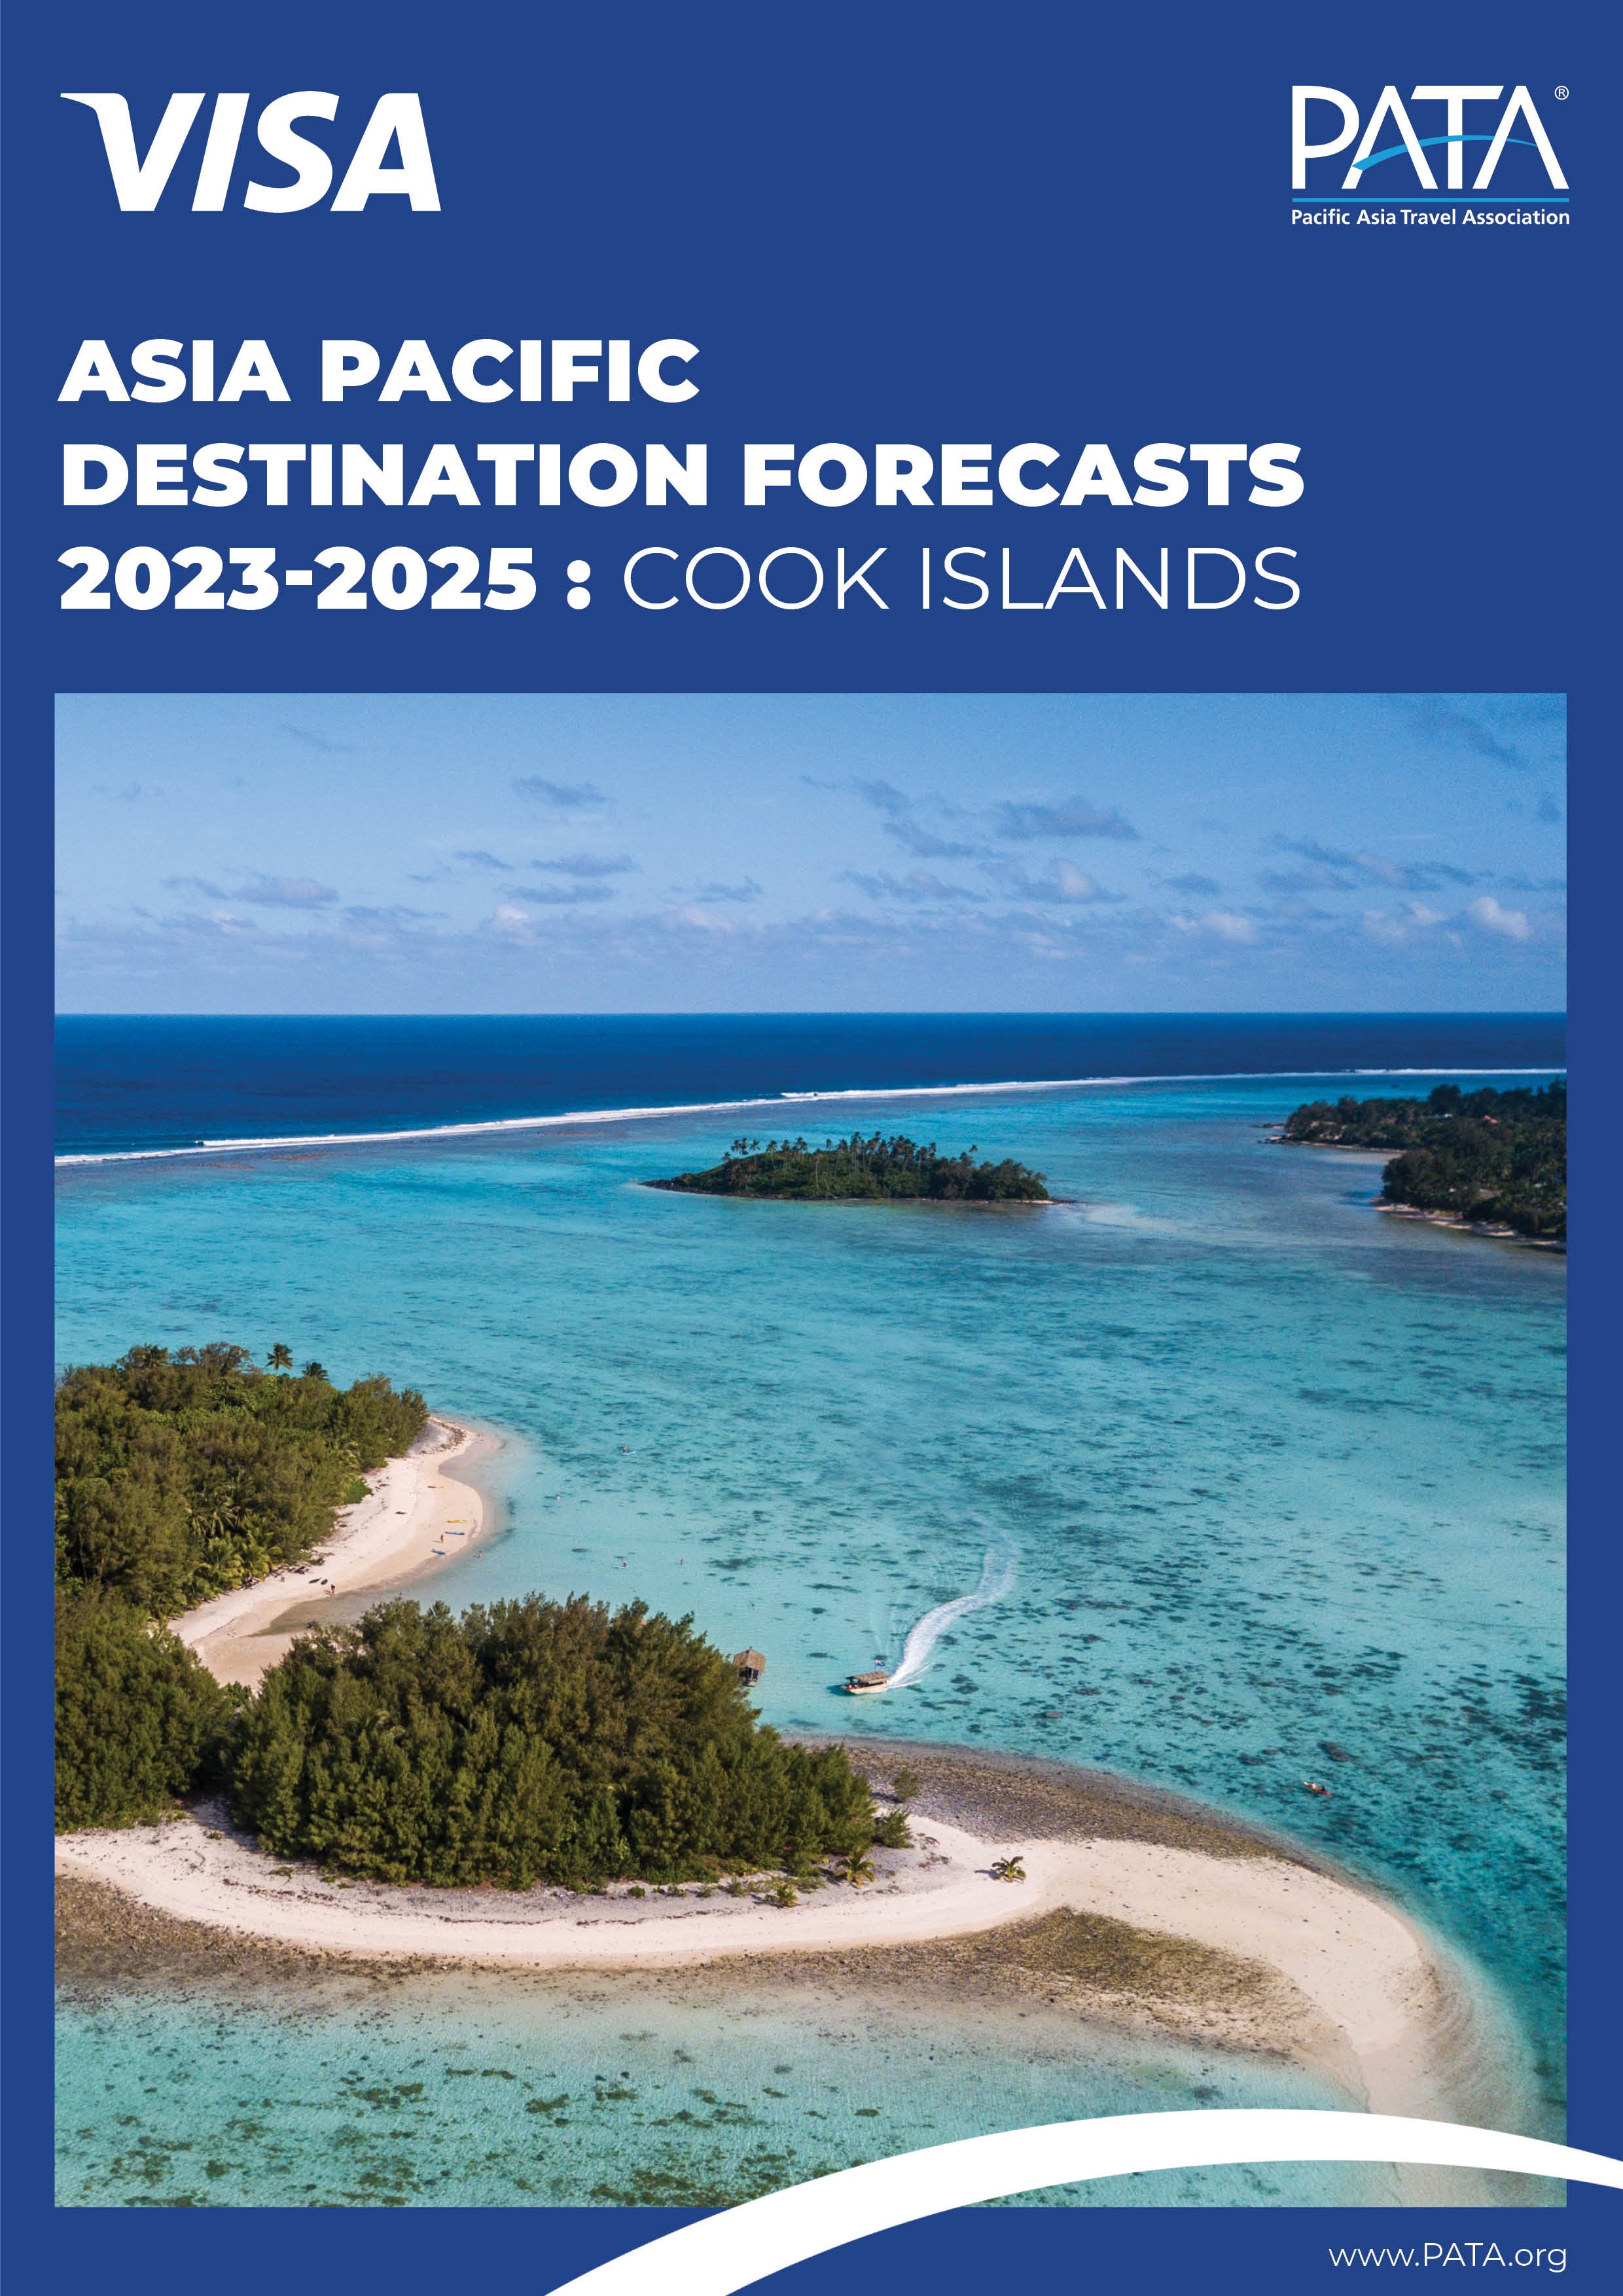
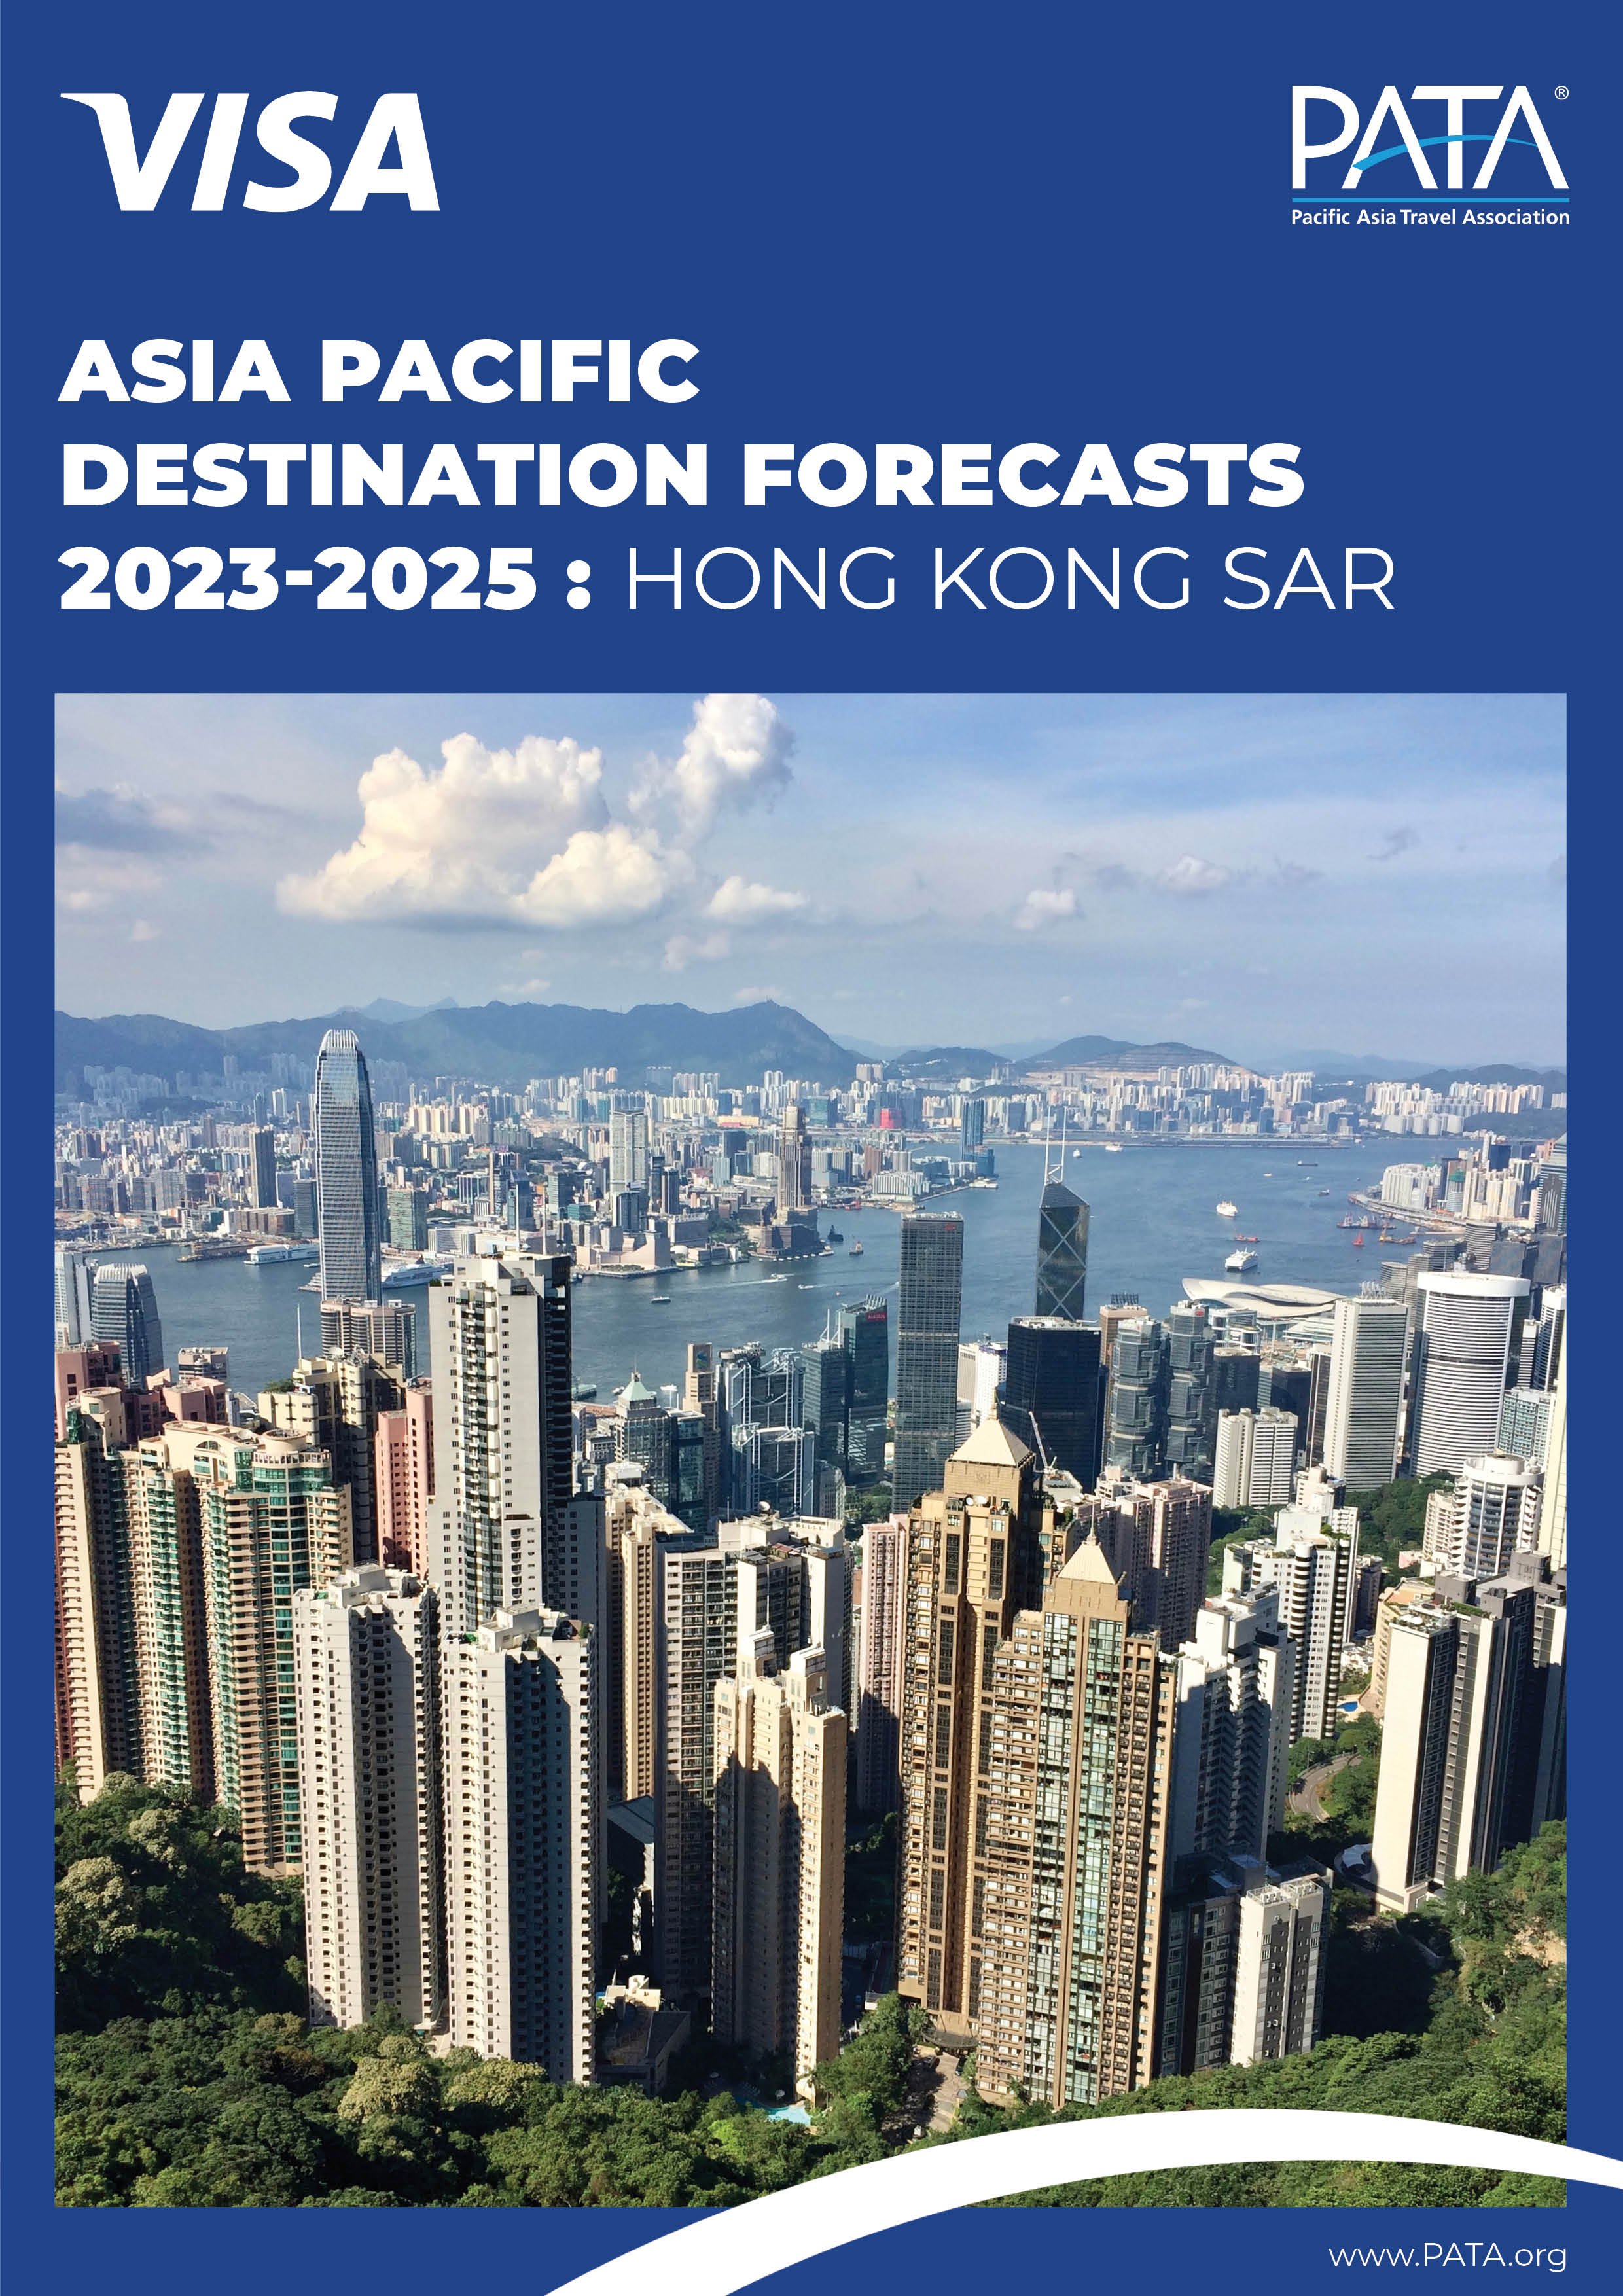
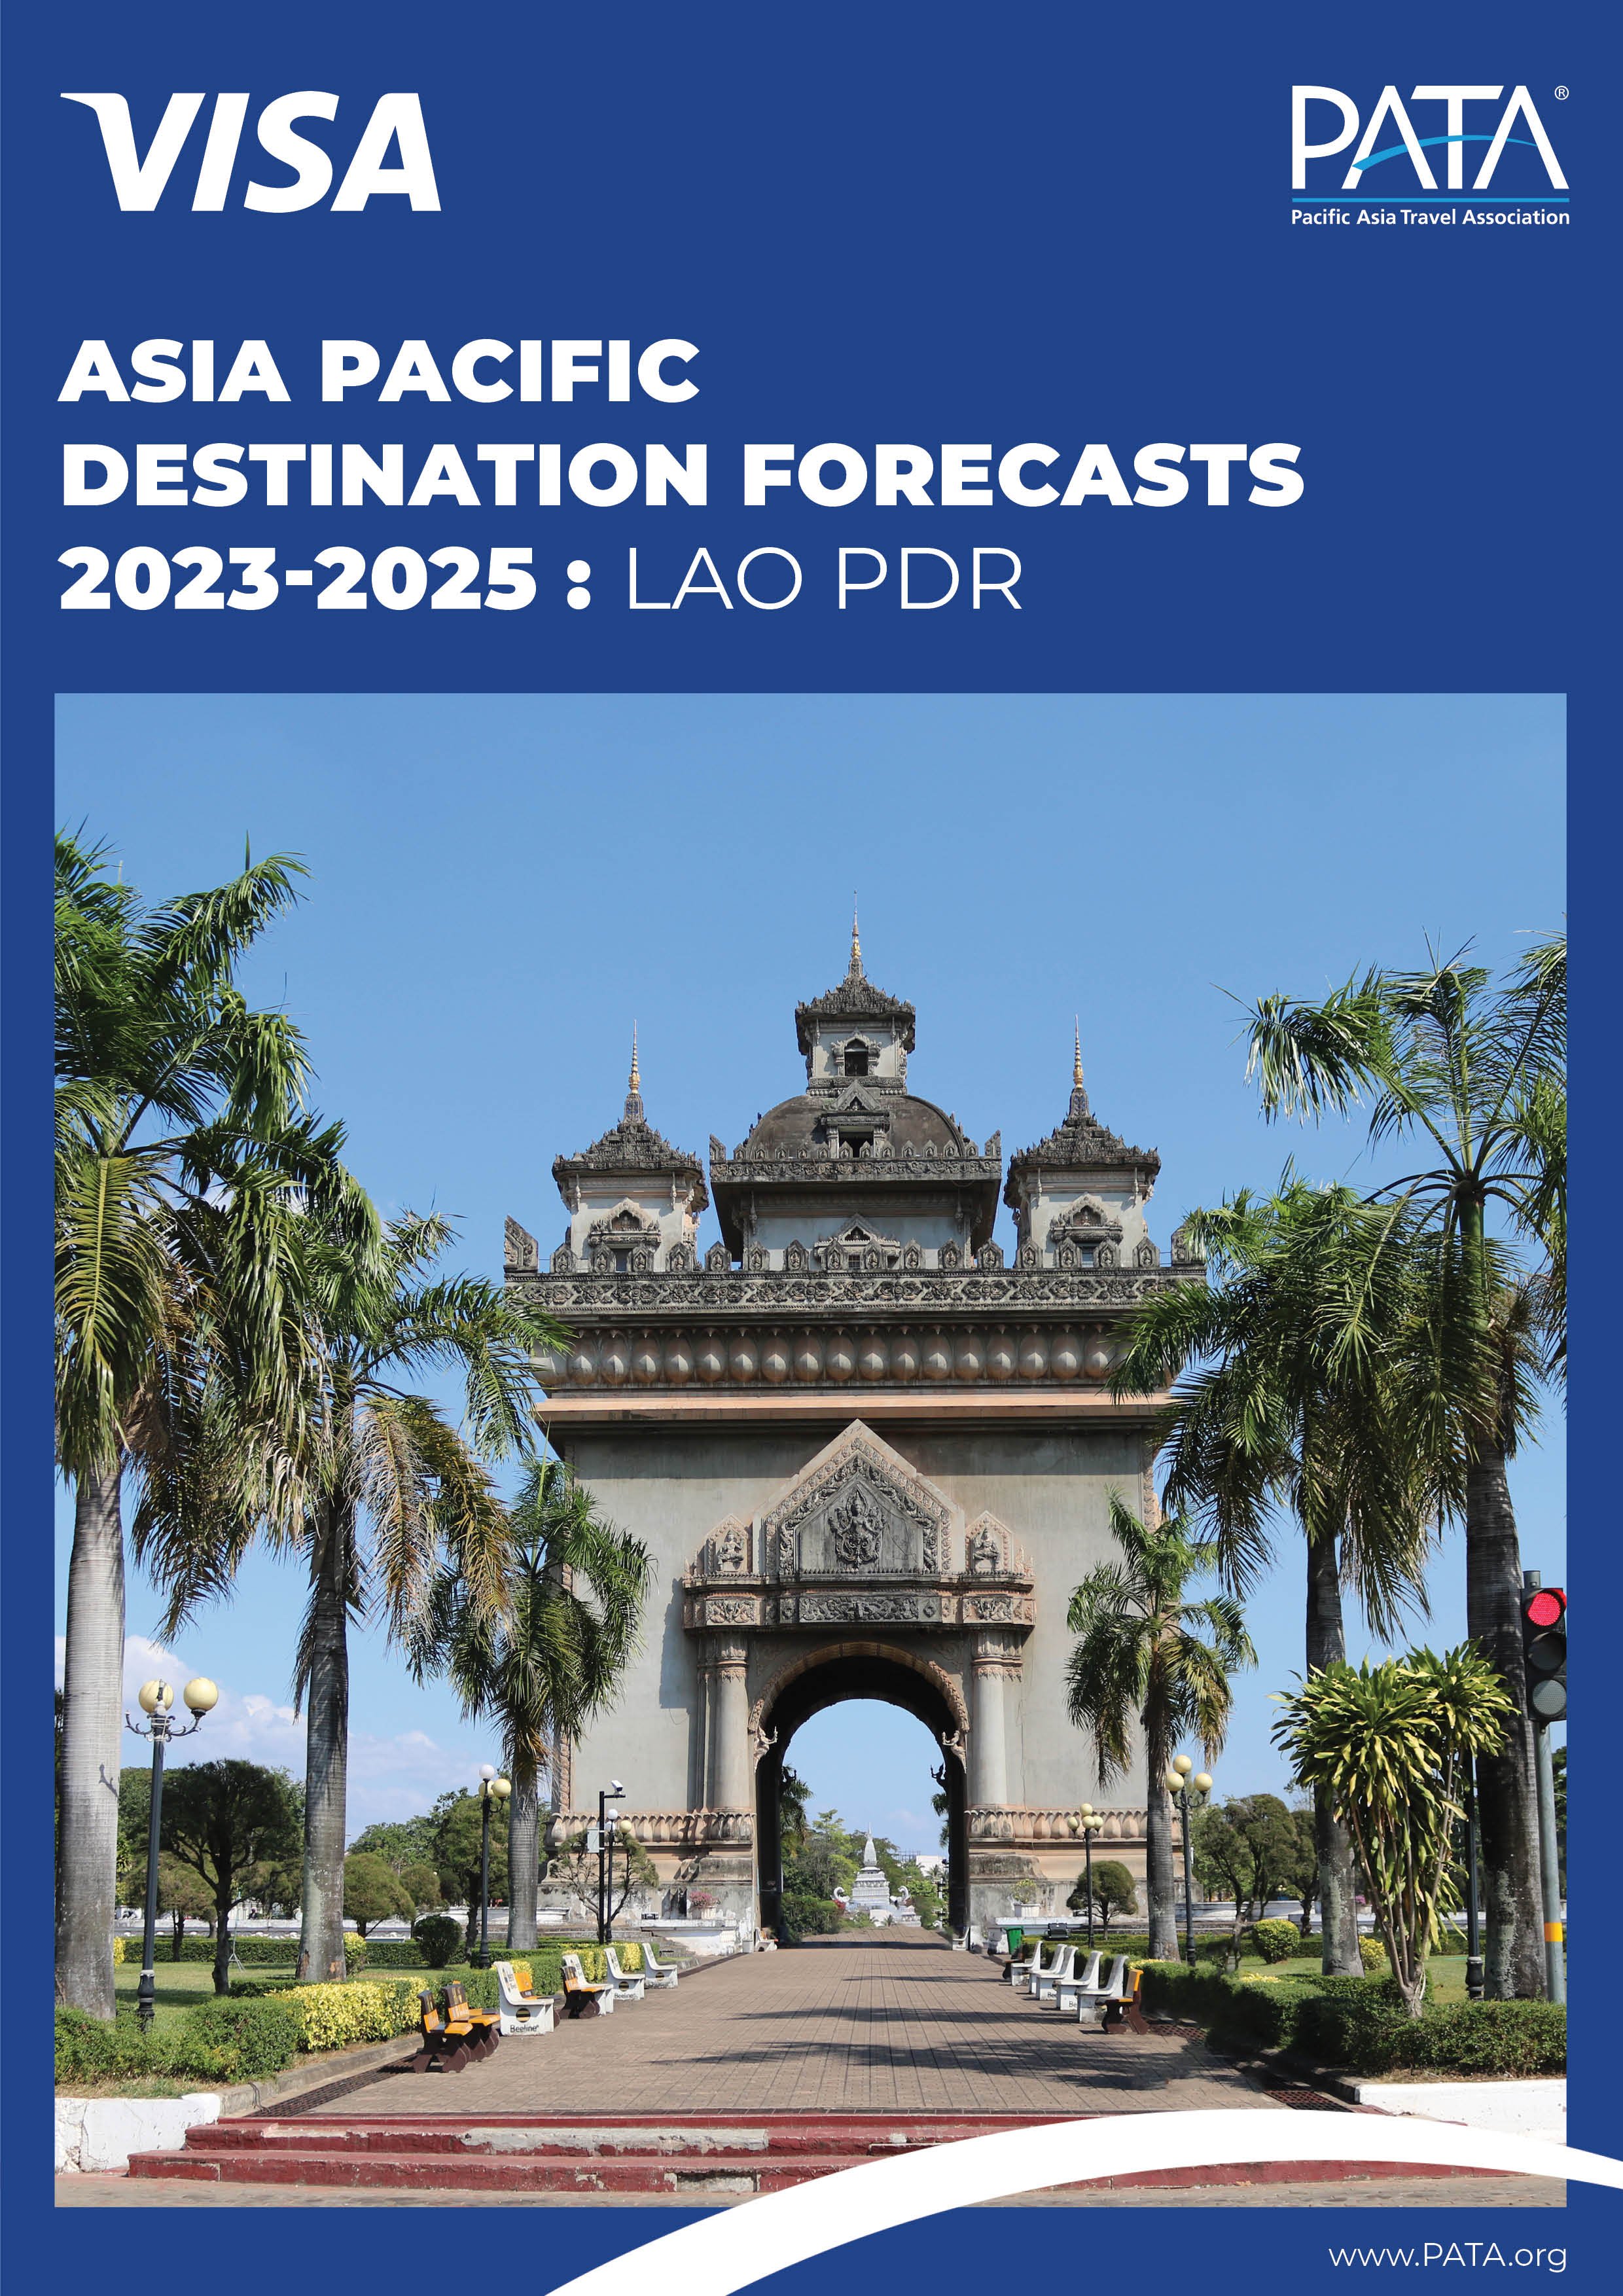
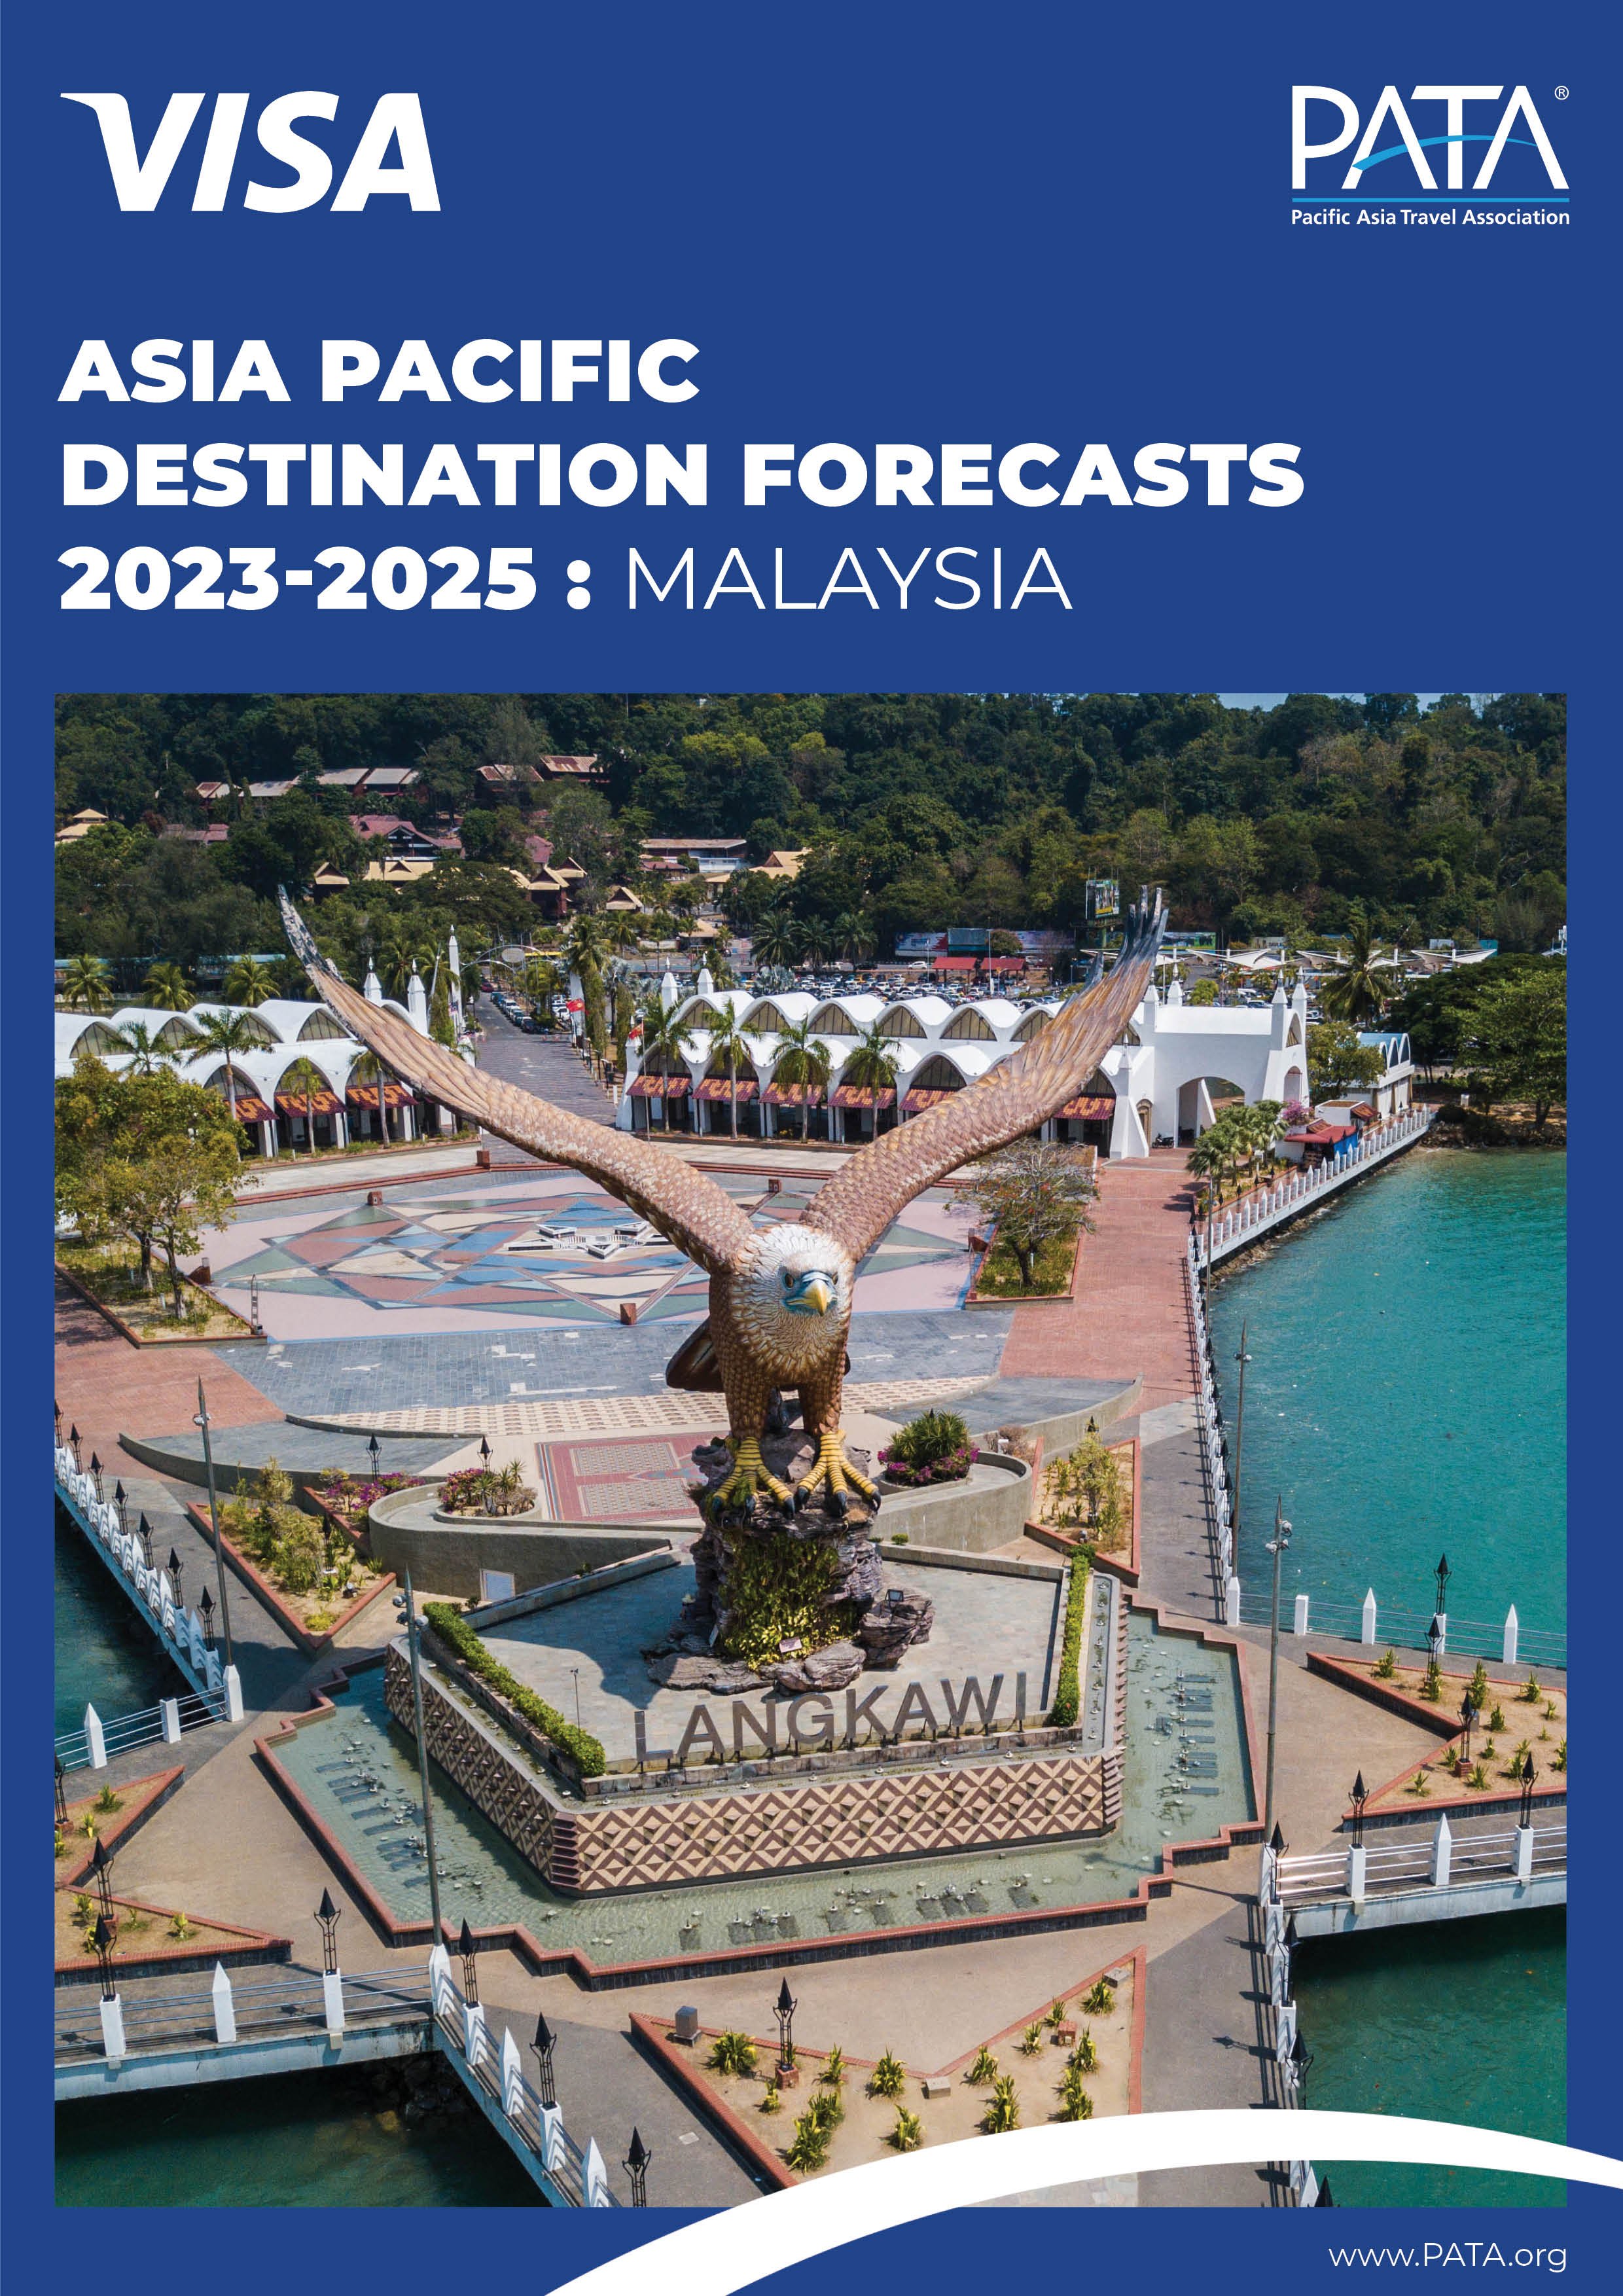
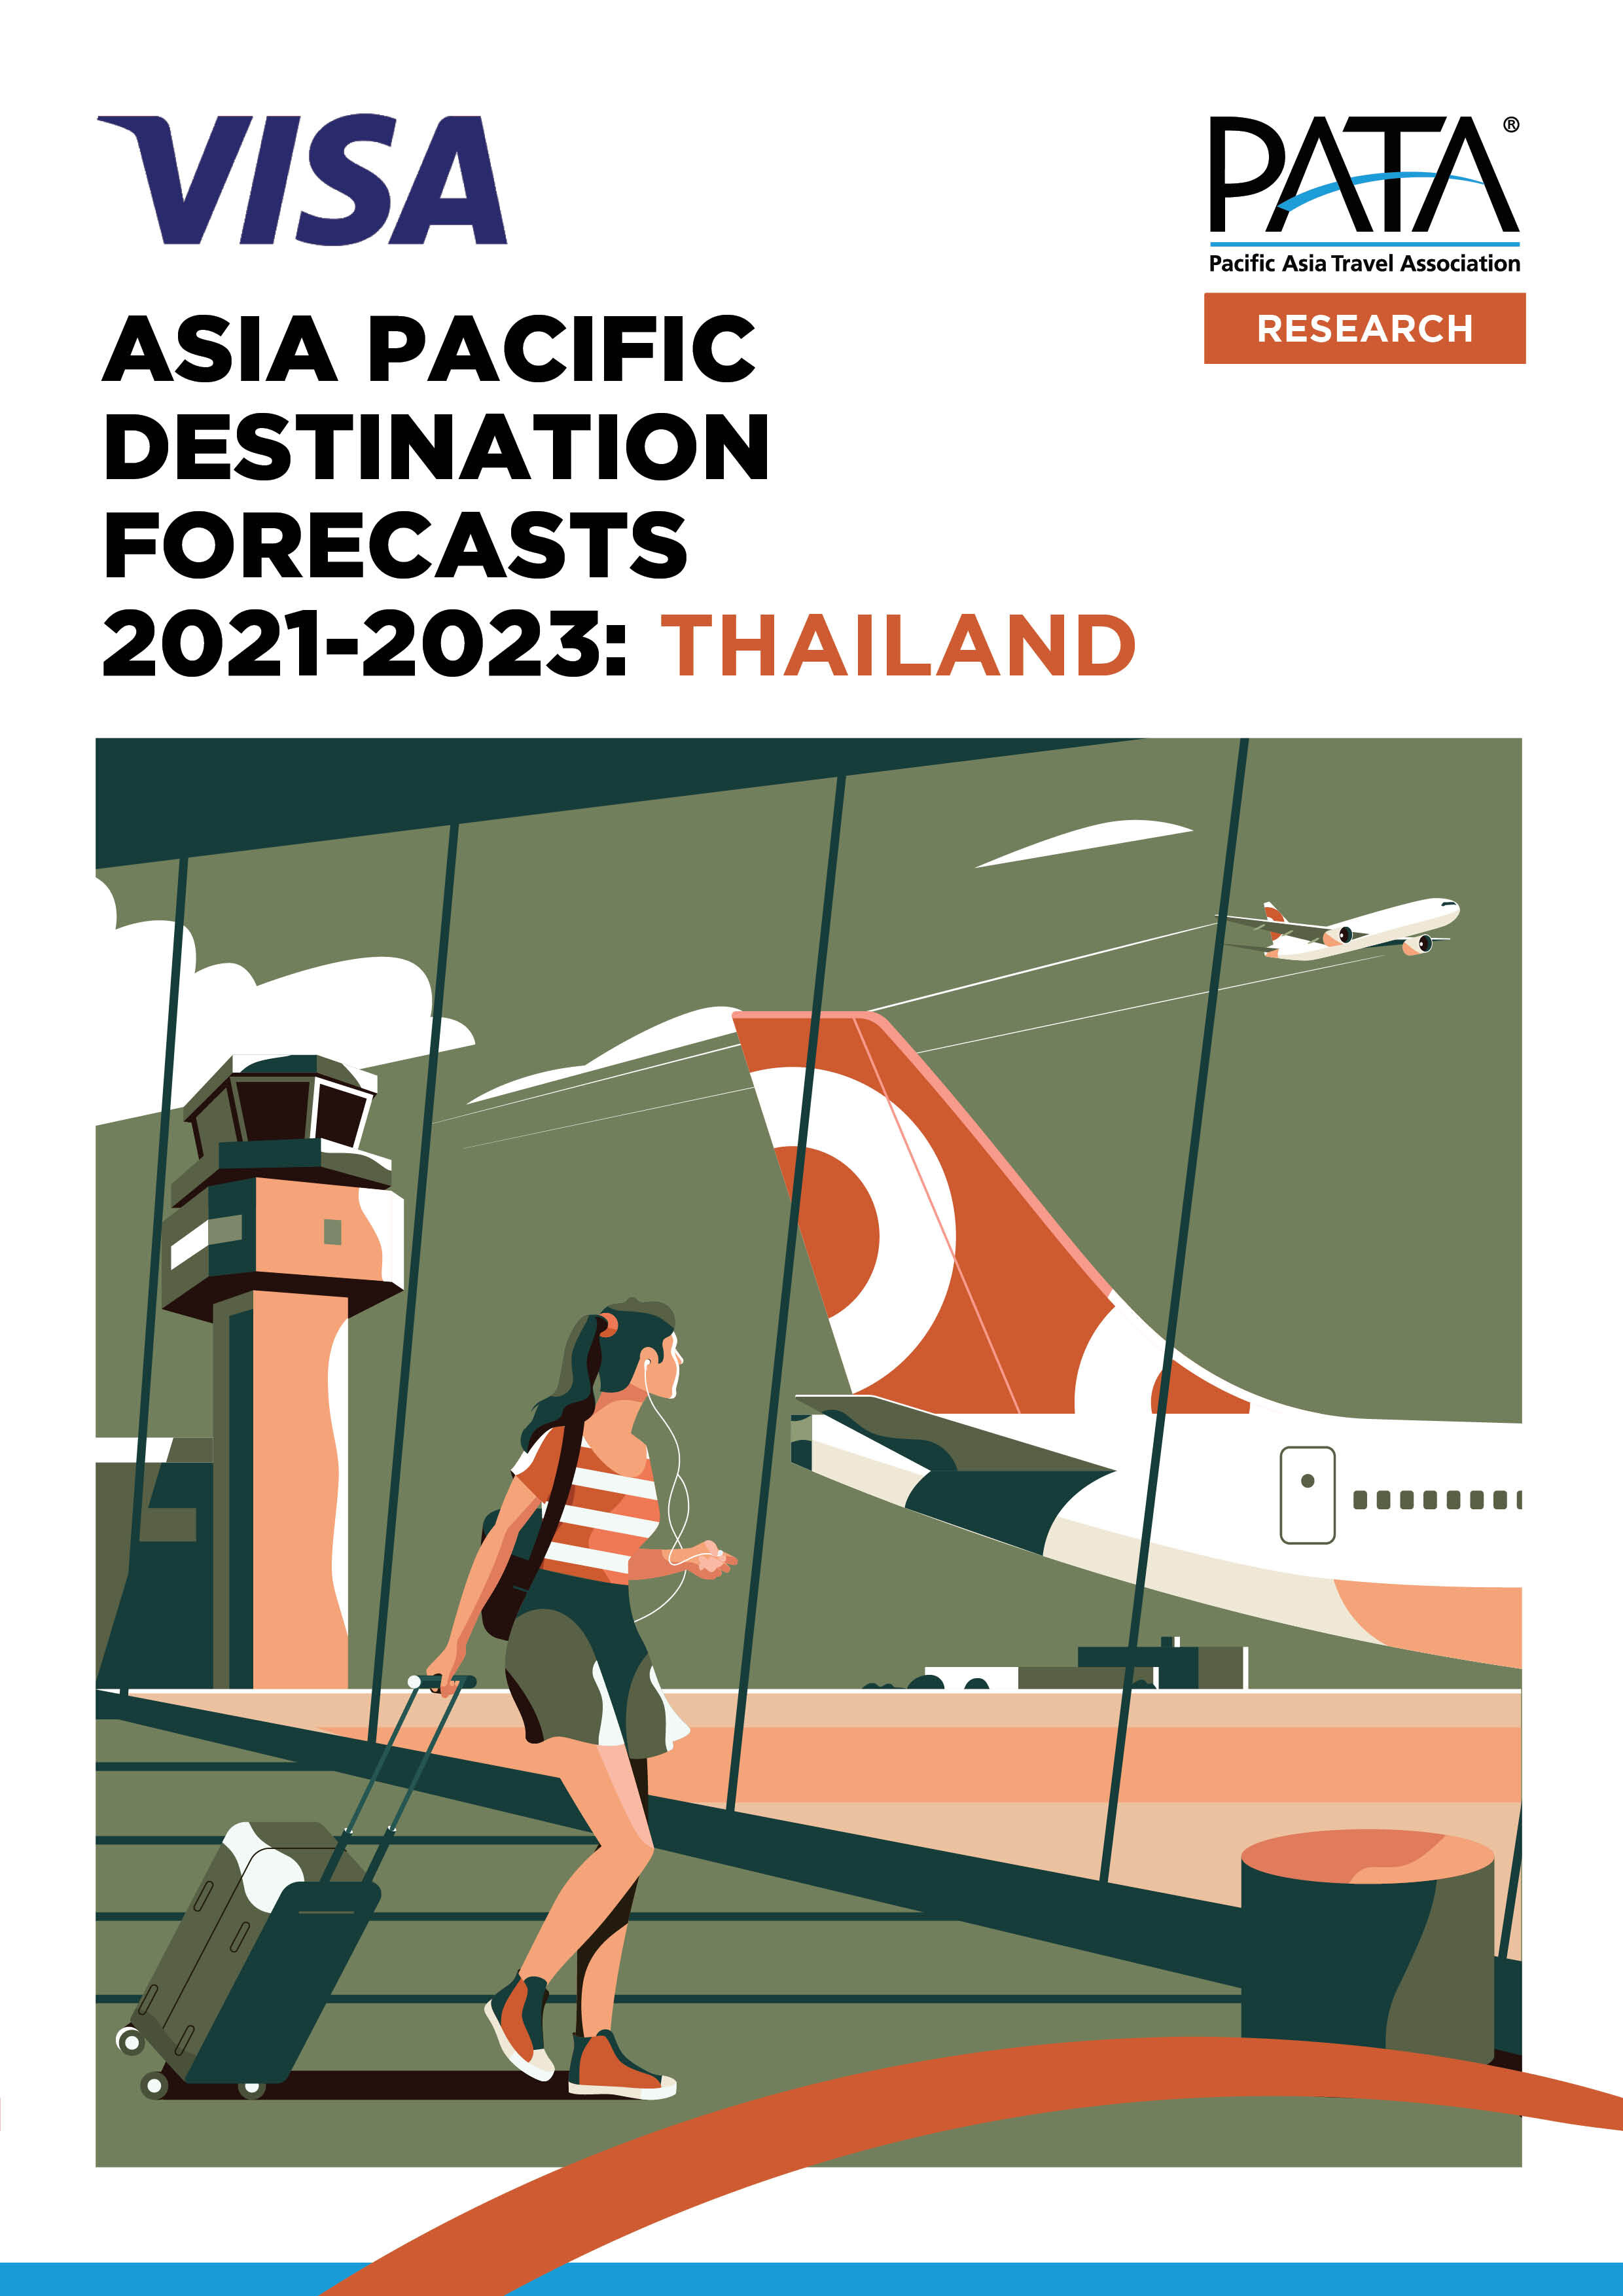
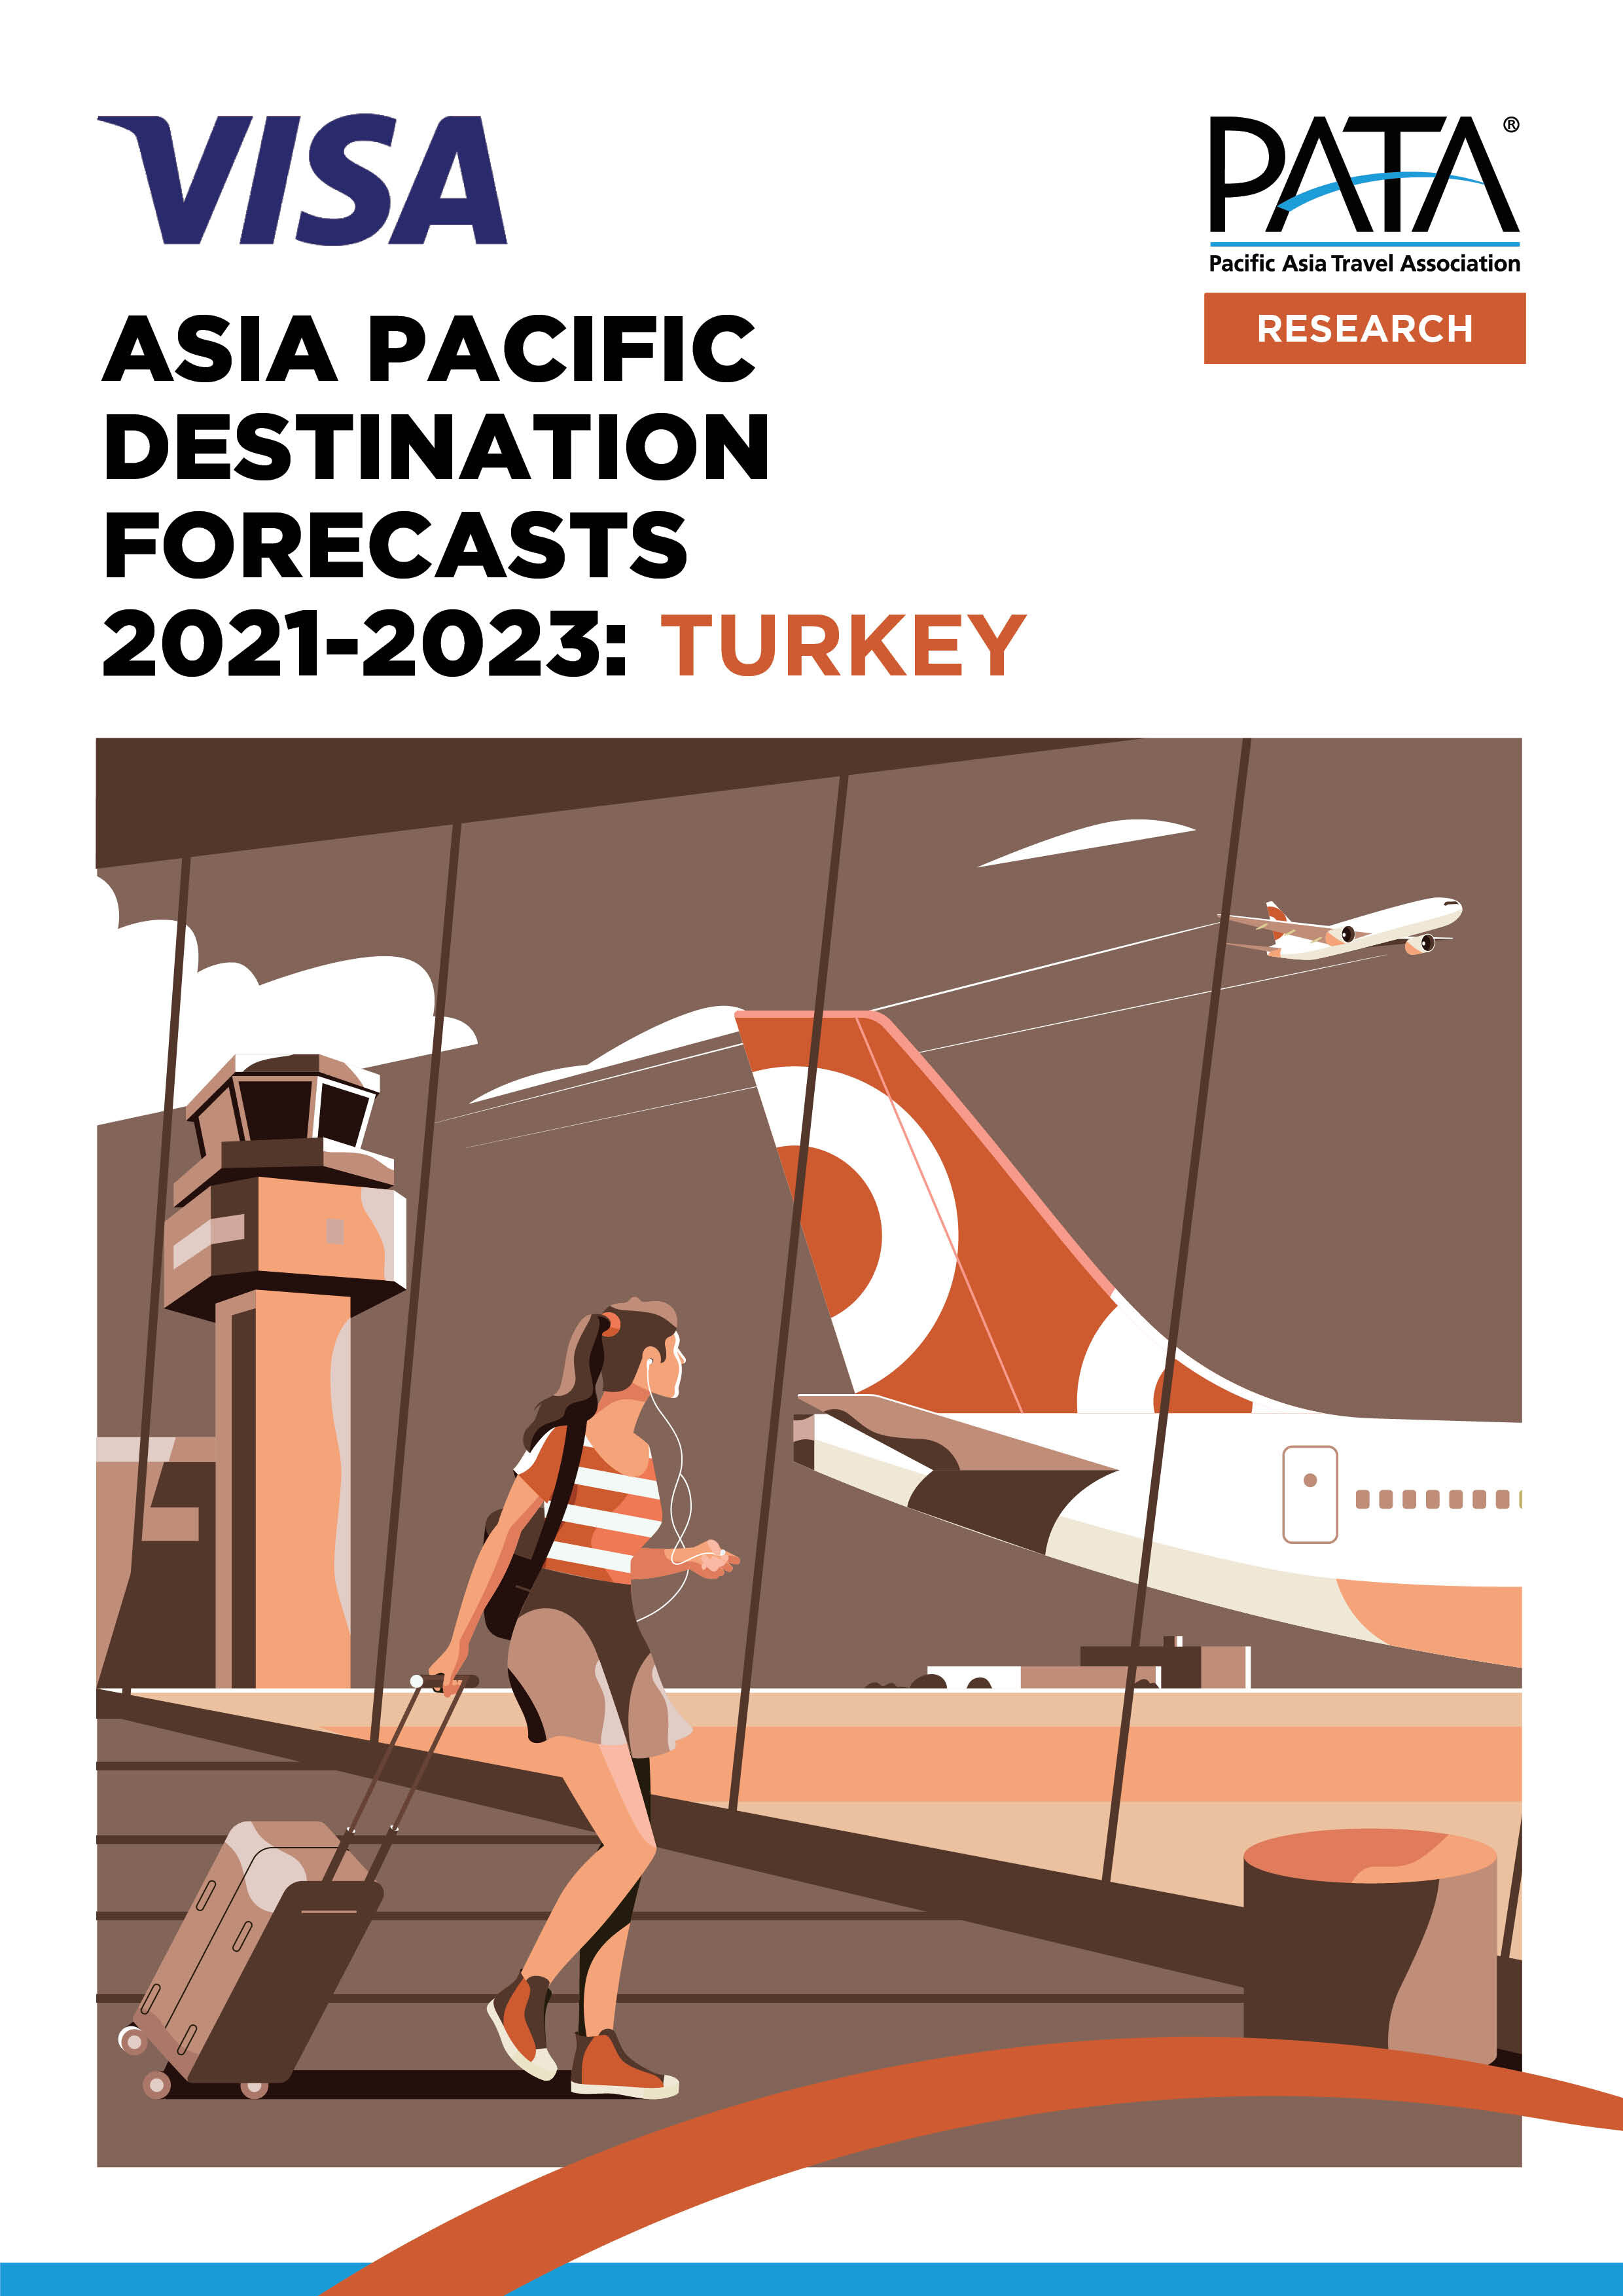
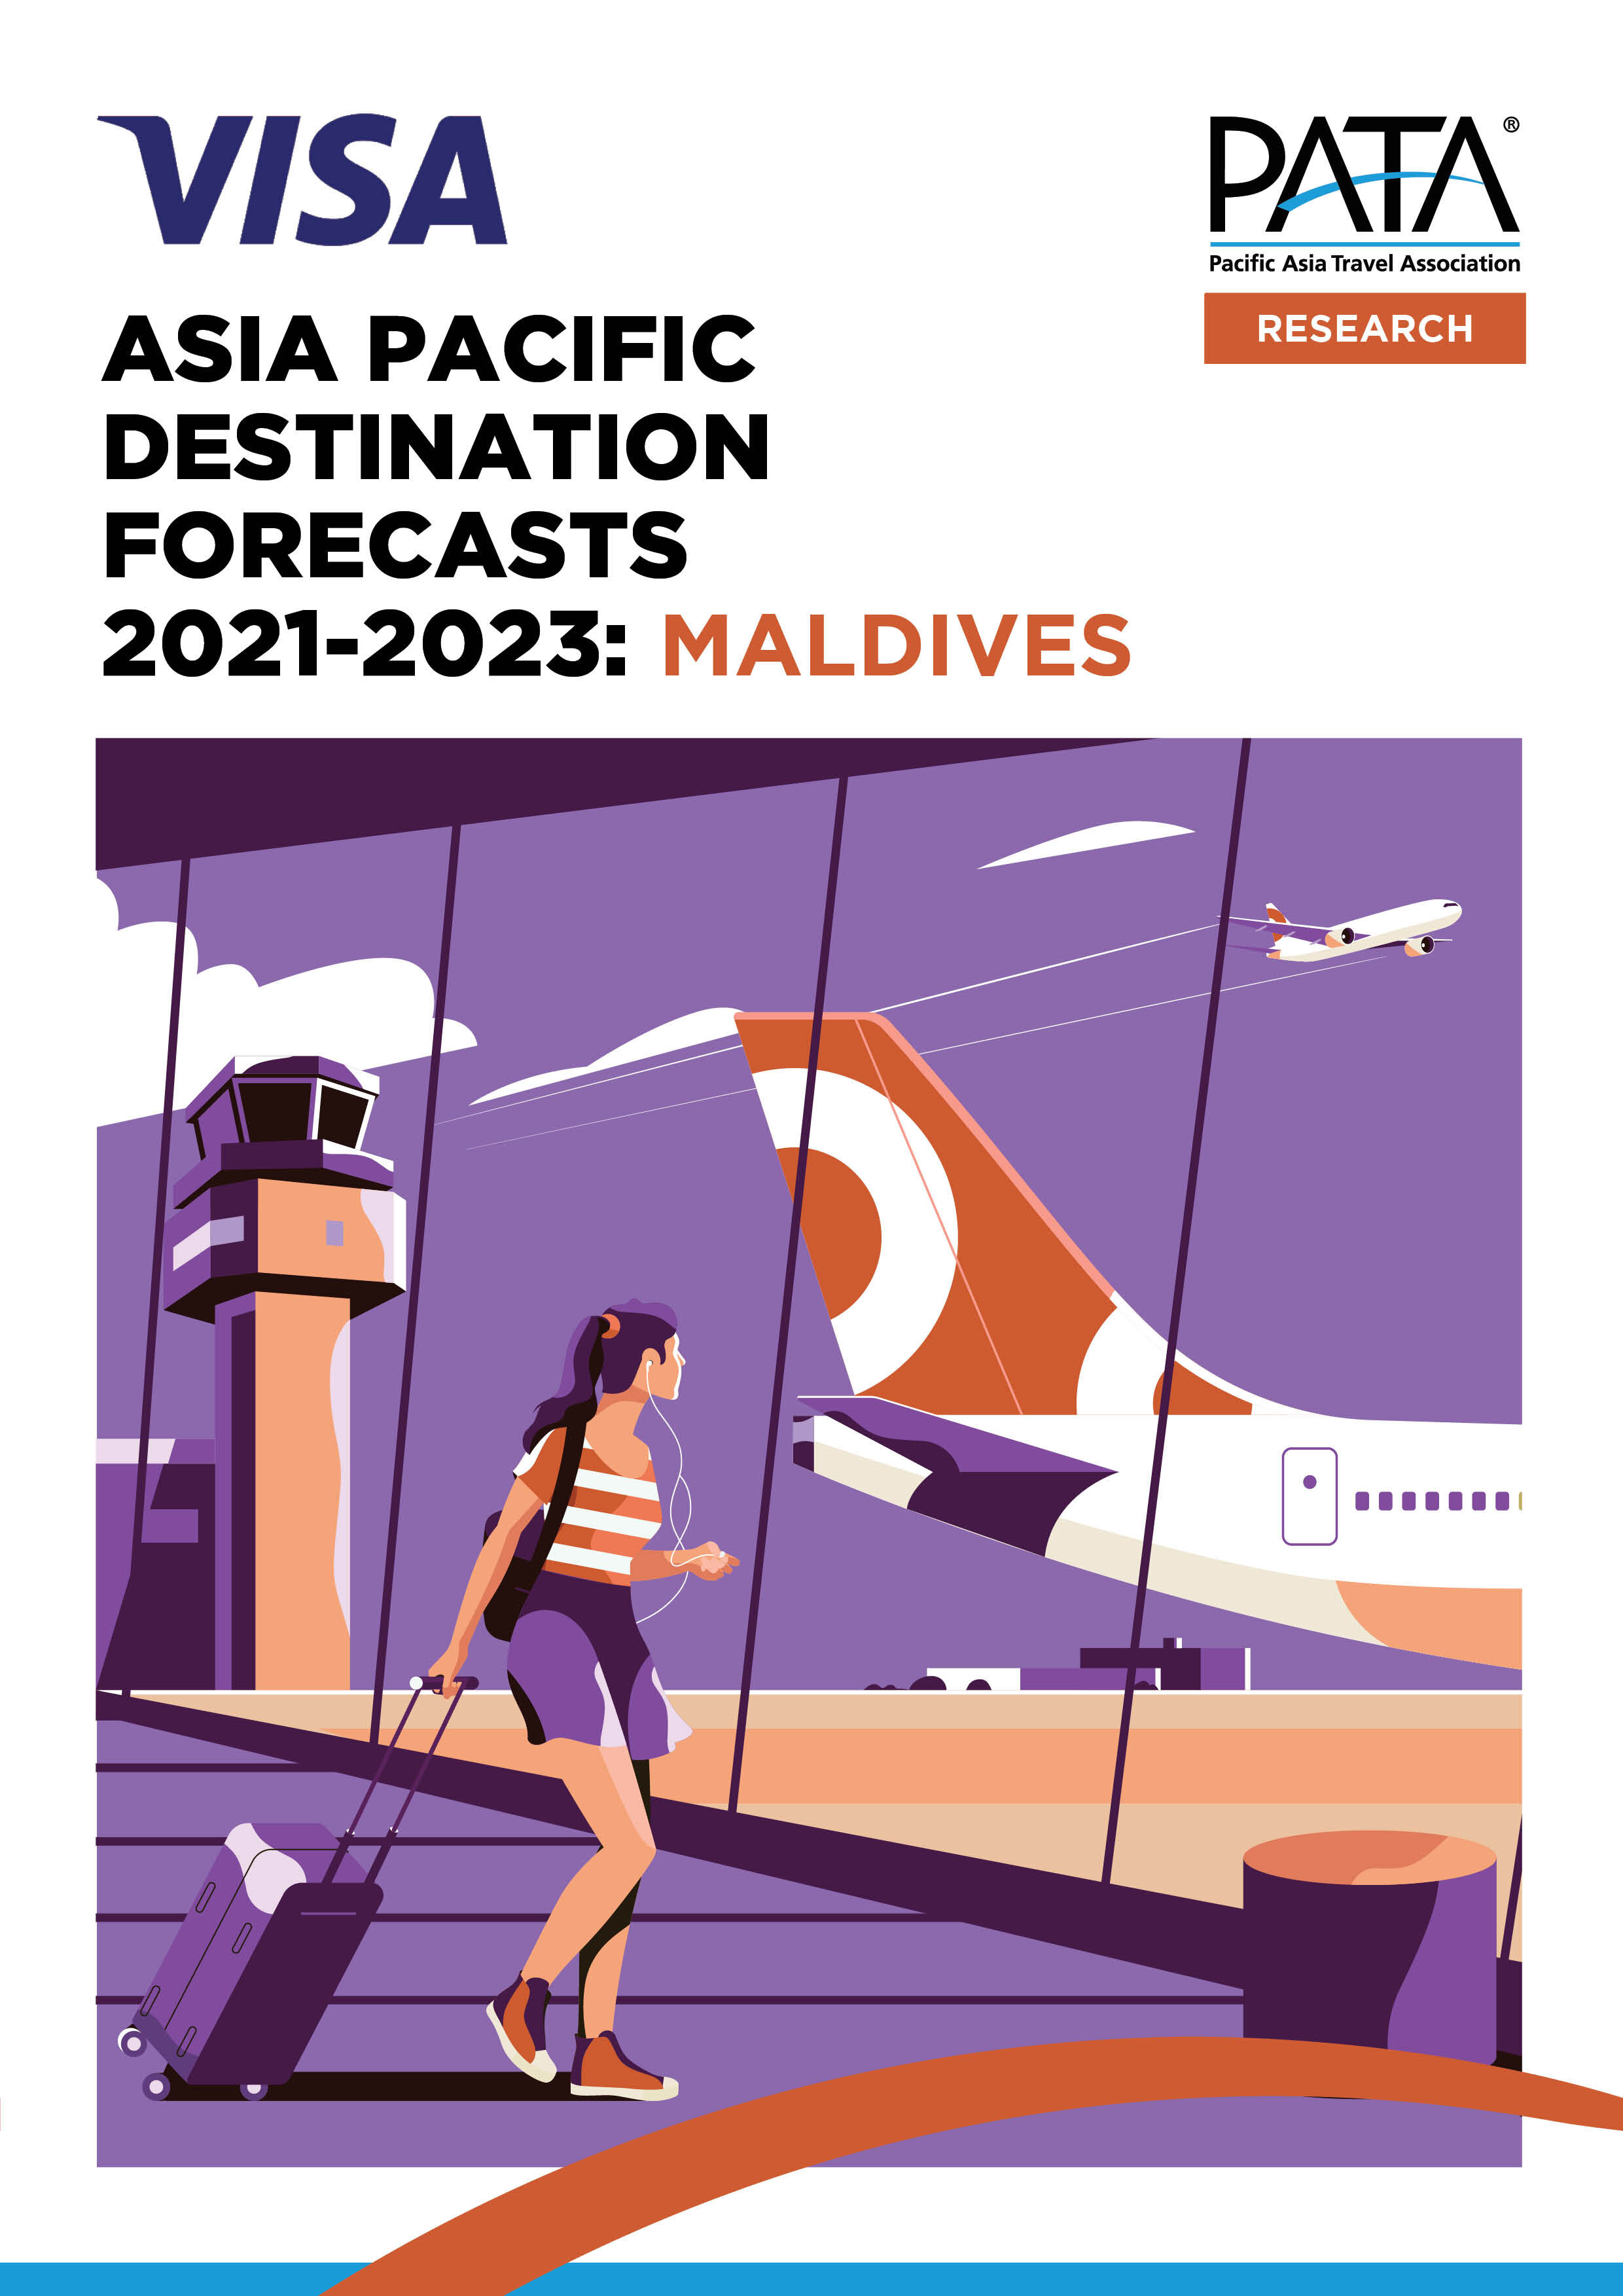
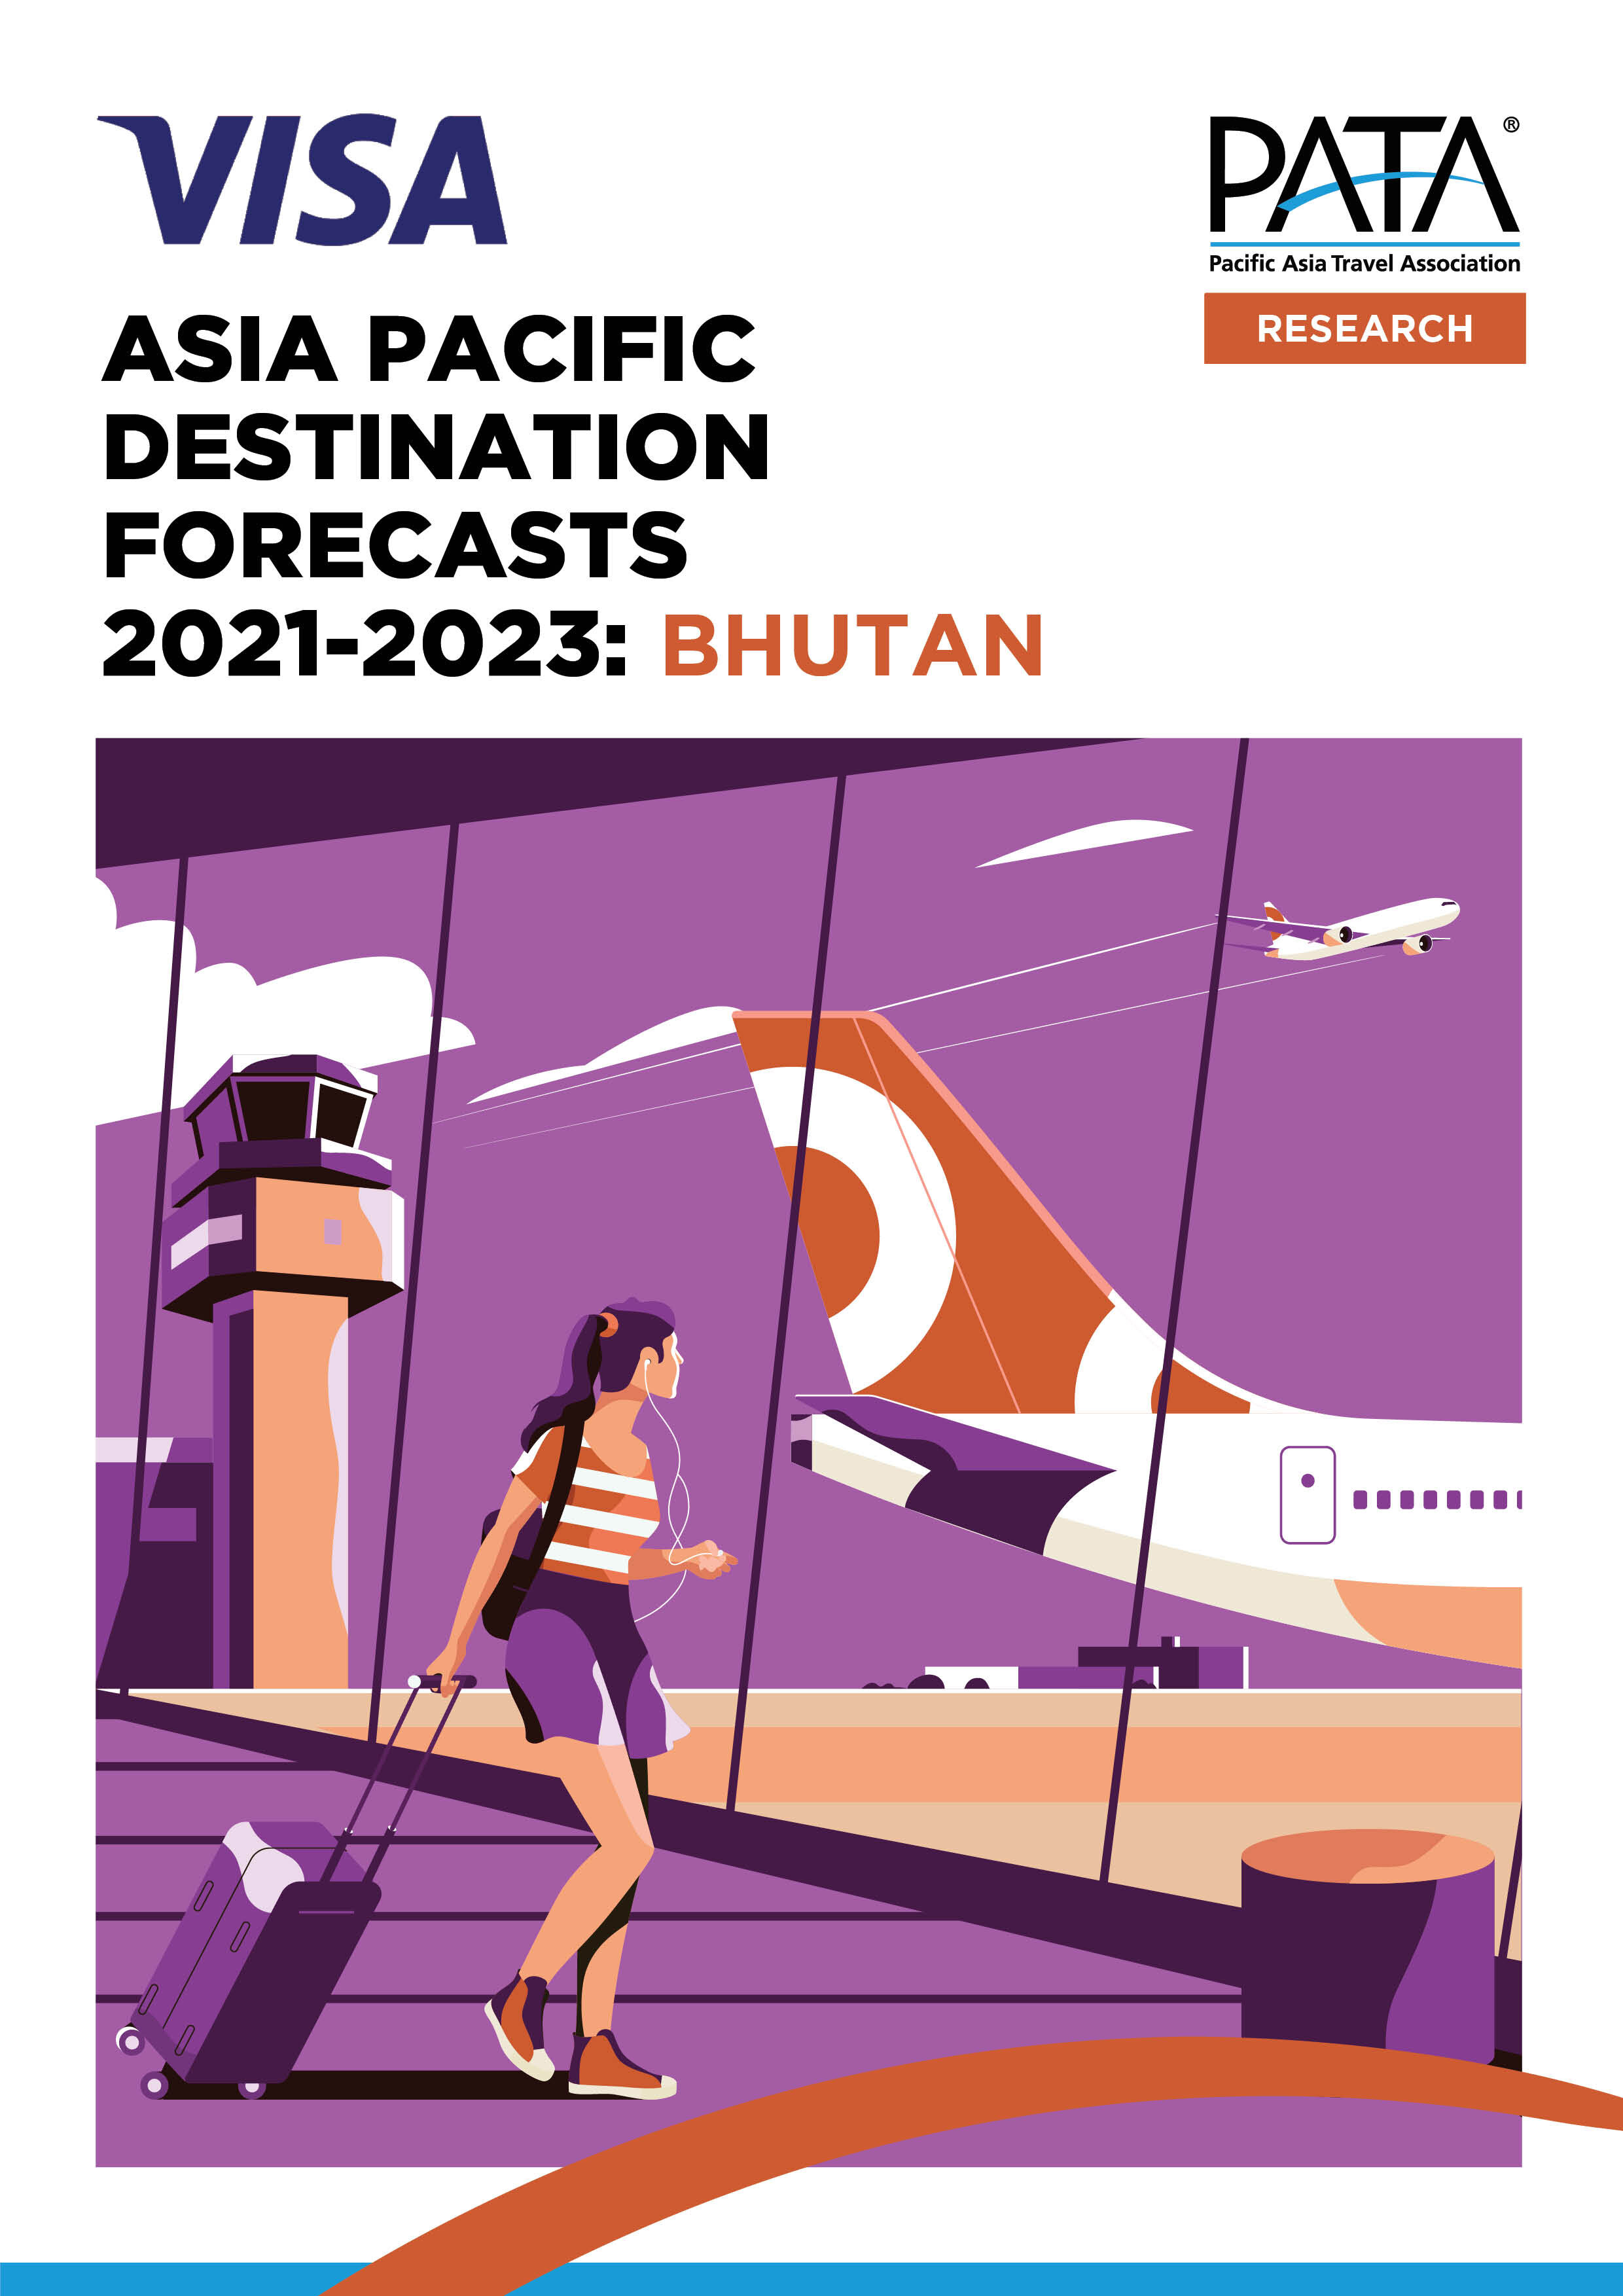
Asia Pacific Destination Forecasts 2023-2025
Please select the destination report(s) of your choice and place the order. We will email you the download link within 1-2 business days.
Pricing 1: Access to all 39 destination reports
Pricing 2: Access to any 5 destination reports
Pricing 3: 50% discount
Chapter Members: $3,000
Please select the destination report(s) of your choice and place the order. We will email you the download link within 1-2 business days.
Pricing 1: Access to all 39 destination reports
Pricing 2: Access to any 5 destination reports
Pricing 3: 50% discount
Chapter Members: $3,000
Please select the destination report(s) of your choice and place the order. We will email you the download link within 1-2 business days.
Pricing 1: Access to all 39 destination reports
Pricing 2: Access to any 5 destination reports
Pricing 3: 50% discount
Chapter Members: $3,000
Pricing 1 Members include: Government Level I, Aviation Level I, Partners (except Alliance Partners)
Pricing 2 Members include: Government Level II (NTO & National Allied Partner), Aviation, Hospitality - Corporate, Hospitality - Corporate Affiliate, Industry - Corporate
Pricing 3 Members include: Government Level II (Province/State, Municipal/CVBs & Provincial/State/Municipal Allied Partner), Alliance Partner, Hospitality - Property, Hospitality - General, Industry - General, Industry - Travel Agency, Industry - Tour Operator, Industry - Association; Industry - Media, Education - Premium , Education - Basic
Exclusive Sponsor:
Sponsored by Visa and with data and insights from Euromonitor International, this suite of reports builds on the current forecasts by delving deeper into the changing dynamics of travel and tourism into and across the Asia Pacific region at the single destination level facilitating the development of appropriate strategies over the next three years. What you will learn from this report:
Each of these 39 reports covers a specific destination in the Asia Pacific and individually provides:
Annual forecasts of visitor arrival numbers into each destination between 2023 and 2025 by scenario and source region;
Recovery rates for international visitor arrival (IVA) growth back to the 2019 benchmark;
Annual changes in relative visitor share by top source market, year, and scenario;
Seasonality pattern;
Quarterly changes in scheduled international inbound air seat capacity to 3Q 2022; and
Economic, income and expenditure outlook & trends, and domestic tourism.
